 NexAIX-官方博客
Why Does Your First Token Take Seconds Longer with the Same Model Name?
In April 2026, tests on DeepSeek V4 Pro (1.6 trillion parameter MoE, supporting 1M context) across multiple providers showed TTFT ranging from under 1 second to several seconds, and output throughput from 30 to over 160 tok/s. This isn't a model issue but a difference in compute architecture and node setup. If you're building your own agent or RAG service and are sensitive to latency and throughput, you need a method to determine with measurable data whether the API you're calling is a genuine self-hosted AI API or a relay station with multiple proxy layers that may be "watered down."
Aligning Definitions: What TTFT, Throughput, and E2E Measure
The three-tier KPI framework proposed by DeepInfra in June 2026 clarifies the semantic boundaries:
- TTFT (Time to First Token): The time from request sent to receiving the first token; reflects queueing and scheduling efficiency.
- Output Throughput: Tokens generated per second; reflects decoding compute and batching strategy.
- E2E (End-to-End Latency): Total time from request to full response; reflects actual user wait time.
These three metrics can be polluted at different stages: network jitter, proxy buffering, and streaming implementation can impact TTFT timing. How first token latency is measured depends on the timing start point—it must be counted from request sent to the first non-empty delta, not to the first chunk arrival. For streaming responses, measure first token time correctly using Python + OpenAI SDK. Example code:
import time
from openai import OpenAI
import statistics

client = OpenAI(api_key="YOUR_KEY", base_url="https://api.example.com/v1")

def measure_ttft():
    start = time.perf_counter()
    stream = client.chat.completions.create(
        model="deepseek-v4-pro",
        messages=[{"role": "user", "content": "写一篇短文"}],
        max_tokens=100,
        stream=True,
    )
    ttft = None
    chunk_count = 0  # 流式 chunk 数为近似速率,精确 token 数以最后一条响应的 usage 为准
    model_field = None
    for chunk in stream:
        if chunk.choices[0].delta.content:
            if ttft is None:
                ttft = time.perf_counter() - start
                model_field = chunk.model
            chunk_count += 1
    elapsed = time.perf_counter() - start
    status = 200
    return ttft, chunk_count, elapsed, model_field, status

N = 100  # 建议不少于 100 次成功请求;若只跑 20–30 次,只报 p50/p95 并明确标注 p99 不可用
samples = []
for _ in range(N):
    ttft, chunk_count, elapsed, model_field, status = measure_ttft()
    samples.append((ttft, chunk_count, elapsed, model_field, status))

ttfts = [s[0] for s in samples]
throughputs = [s[1] / s[2] for s in samples]  # chunk/s

p50 = statistics.quantiles(ttfts, n=100)[49]
p95 = statistics.quantiles(ttfts, n=100)[94]
p99 = statistics.quantiles(ttfts, n=100)[98]
print(f"TTFT p50/p95/p99: {p50:.3f}/{p95:.3f}/{p99:.3f} s")
print(f"输出速率均值: {statistics.mean(throughputs):.1f} chunk/s")
Output is the measured value in your local environment; this article does not provide measured values from any provider. Note that streaming chunk counts are only an approximate rate; the exact token count is based on the usage field in the final response.
Mapping Table: Three-Tier KPIs and Detection Signals
| KPI | Reflects | Pollution Points | Detection Signals |
|---|---|---|---|
| TTFT | Queueing & scheduling | Network, proxy buffering | p95/p99 divergence |
| Throughput | Decoding compute | Batching strategy | Throughput collapse |
| E2E | User waiting | Entire chain | Cross-time drift |
What DeepInfra's KPI Framework Shows: Differences Between Self-Hosted AI APIs and Proxy Relays
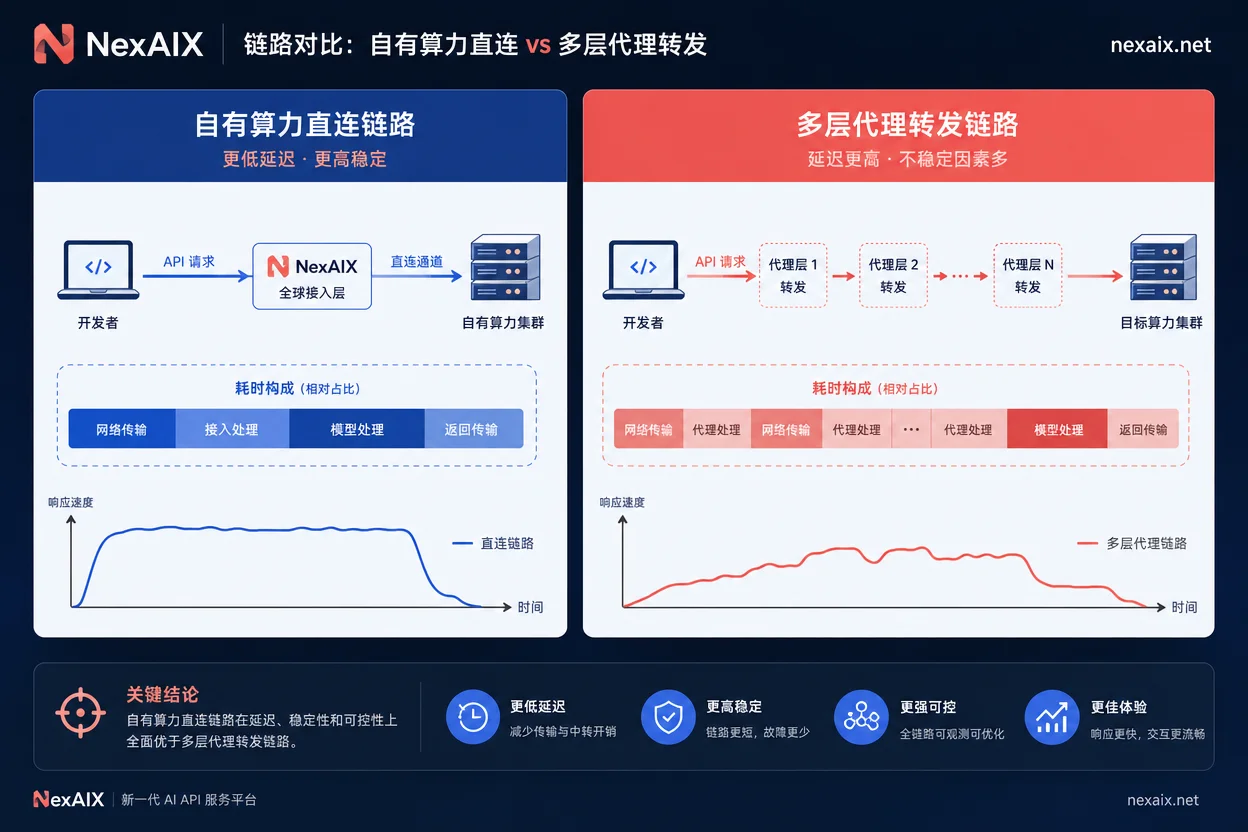
DeepInfra emphasizes that self-hosted infrastructure can provide deterministic performance guarantees under moderate to high concurrency and long-context scenarios. Multi-layer proxy relays introduce additional queueing and routing uncertainty. Aggregator relay platforms (like OpenRouter) ensure connectivity through automatic cross-provider routing, but developers worry about silent routing causing model downgrades or inconsistent behavior. Self-hosted providers fix underlying nodes and transparently relay the actual execution model, ensuring consistency. However, these two paths are business trade-offs, not inherently superior or inferior: if your business values connectivity, a relay station might be more suitable; if you value stable performance, self-hosted is more controllable.
Load Testing Protocol: Fixed Prompt, Fixed Output Length, Concurrency Gradients, and Time-Slot Sampling
To distinguish self-hosted AI APIs from proxy relays, you must design a reproducible load testing experiment. The following process is both a test method for LLM API throughput and a basis for determining at which concurrency tier collapse begins:
- Fixed prompt template: Use a prompt representative of production scenarios, with fixed input length.
- Fixed max_tokens: For example, set to 100 to control output length.
- Disable randomness: Set temperature=0 and fix seed. Note: some compatible endpoints may not support seed or ignore temperature=0; run a consistency check before formal sampling. If unsupported, switch to fixed prompt with multiple samples taking percentiles, and note this limitation in the report.
- Concurrency gradient: 1, 4, 8, 16, 32, with at least 100 successful requests per tier (lower bound for p95 interpretation). If only 20–30 requests are run, report p50/p95 only and clearly note p99 is unavailable.
- Time-slot sampling: Cover weekday peak (e.g., 10:00-12:00) and early morning trough (e.g., 3:00-5:00).
- Record metadata: request id, model field in response, usage token counts, status codes. Each field has an acceptance purpose: request id for tracing anomalies with the provider, model field to verify no replacement, usage token counts for cross-checking with local tokenizer estimates, and status codes to differentiate rate limiting from failures.
This section's script is a single-concurrency skeleton; concurrency gradients need to use thread pools or asyncio to concurrently invoke the same function, implementation not covered here.
Five Executable Data Sets: Percentile Divergence, Throughput Collapse Point, Cross-Time Drift, Long-Output Stability, and 429 Predecessors
Thresholds below are methodological illustrations; calibrate with your baseline data. No measured values from any provider are provided.
Percentile Divergence (TTFT p50 vs p95/p99)
AI API latency p95 p99 analysis focuses not on the mean but on tail behavior.
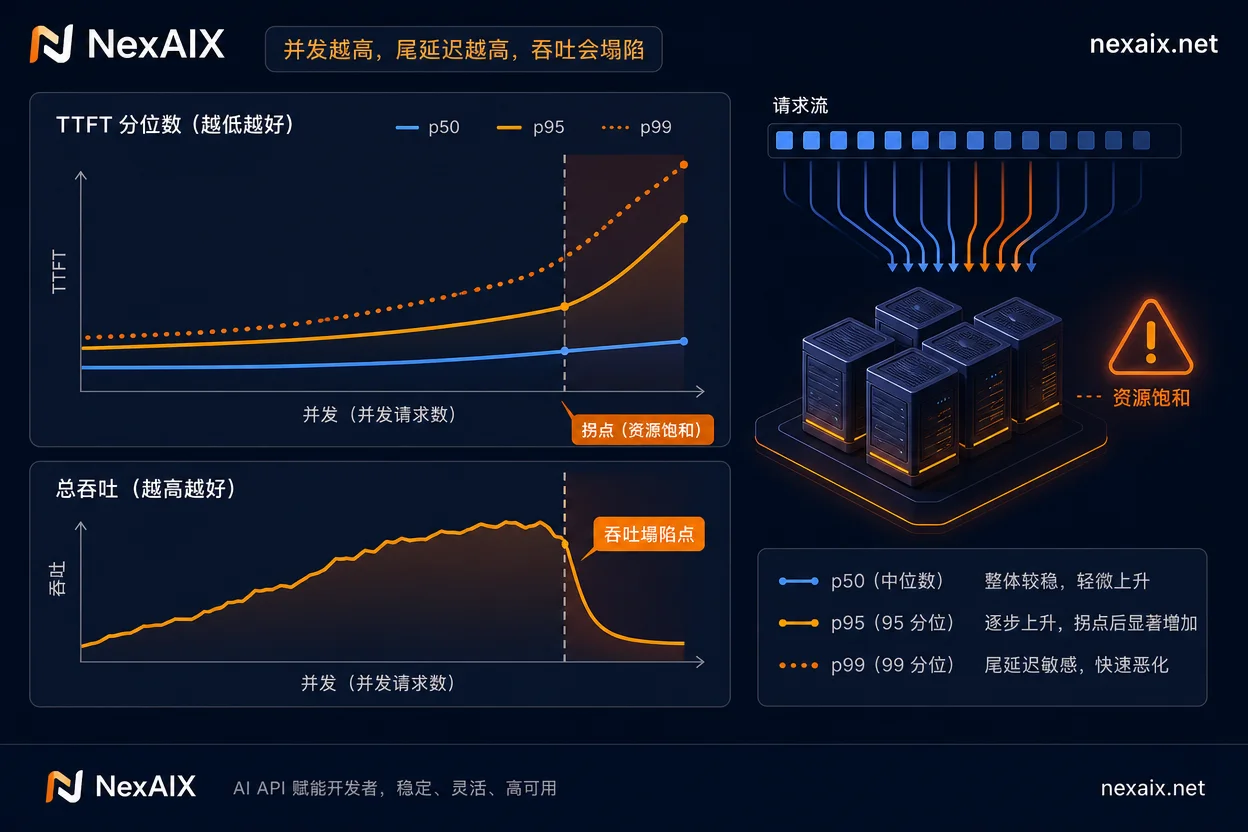
- Signal: The ratio of p95/p99 to p50 consistently exceeds a threshold you set (e.g., 3–5x, set based on your SLA).
- Possible Cause: Request queueing or resource contention, common in shared resource pools.
- Cross-Validation: Check if p95 worsens as concurrency increases.
- Specific Action: Simultaneously record network RTT baseline (e.g., TCP handshake timing to base_url) and subtract network jitter before judging if p95/p99 divergence is from server-side queueing.
Throughput Collapse Point
- Signal: When concurrency increases from tier k to k+1, total throughput does not increase but decreases.
- Possible Cause: Backend capacity hit or rate limiting activated.
- Cross-Validation: Simultaneously record 429 rate, whether Retry-After header and quota details are present. If throughput collapses without any 429 and model field unchanged, investigate queueing rather than rate limiting, and do not conclude inflation solely based on this.
Cross-Time Drift
- Signal: At same concurrency, TTFT and throughput measured in early morning are significantly better than during the day.
- Possible Cause: Shared resource pool or routing changes over time.
- Cross-Validation: Check if the model field in responses remains consistent.
- Specific Action: Both time slots must use the same prompt, same concurrency tier, and same client egress network; record start/end timestamps in the report. Otherwise, drift conclusions are invalid.
Long-Output Stability
- Signal: Output token/s decays over time, especially when output length enters your business's long document range.
- Possible Cause: Increased attention computation under long context, or batch squeezing.
- Cross-Validation: Compare throughput curves under different max_tokens.
- Specific Action: Segment statistics by output progress (e.g., every 200 tokens) and plot a decay curve rather than only the segment average. The location of decay is more diagnostic than its magnitude.
429 Predecessors
- Signal: A gradual latency increase appears before 429 errors.
- Possible Cause: Queueing before rate limiting triggers.
- Cross-Validation: Confirm whether 429 includes Retry-After header and whether error messages are explicit.
Note: A single signal is insufficient to conclude; cross-validation is required.
Performance Anomalies ≠ Inflation: Cross-Validate with Model Field, Token Count, and Error Codes
Performance differences do not equal inflation. To determine "silent downgrade," verify:
- Model Field: Whether the model in the response matches the request.
- Token Count: Whether usage token counts align with local tokenizer estimates in magnitude.
- Error Codes: Whether standard 429 or silent downgrade occurs under load.
Small relay stations claim "100% original channels," but without a public status page and complete model field, it's unverifiable; only re-testable data can guide judgment.
Connecting the Load Test Script to a Unified OpenAI-Compatible Endpoint for Horizontal Comparison
Horizontal load testing requires a unified OpenAI-compatible interface. NexAIX provides base_url https://api.nexaix.net/v1. NexAIX deploys open-weights models on its own compute cluster and uses official authorized channels for closed-source models, so the model field and 429 behavior to check are semantically consistent within the same endpoint. Verification items:
- Model Field Transparent: Compare request and response model fields.
- Standard 429 with Retry Suggestions Under Load: Observe whether retry information is provided rather than silent switching.
- Verifiable usage Metadata: Only retain request ID, model name, token count, timestamp, status code, directly matching the fields recorded in the load test script.
- No Prompt/Completion Logging: Test sample content does not enter logs.
You can use your test quota to run the same script on NexAIX under this protocol and verify the above fields. Specific specs and availability are subject to the current model page and changelog.
Supplier Acceptance Checklist: 8 Metrics and Commitments Required Before Signing
| Metric | Requirement |
|---|---|
| TTFT p50/p95/p99 | Percentiles at specified concurrency |
| Output token/s | Average and minimum values |
| E2E upper bound | Maximum acceptable latency |
| Rate limit and quota rules | Clear per-minute/per-hour limits |
| 429 behavior | Standard error code + retry suggestion |
| Model field transparency | Must match actual executed model |
| Log retention | Request ID, token counts, timestamps, etc. |
| Status page and change notifications | Public status page, advance notice for major changes |
Note: Currently there is no public third-party statistics on average recovery time (MTTR) after 429 for relay stations; this must be self-proven or observed through long-term sampling.
Conclusion: Define Metrics First, Then Discuss Stability
Stability isn't an adjective; it's percentiles. The first step in choosing is writing acceptance metrics into the contract or internal eval, and the second step is comparing prices. We suggest you run a baseline on your production prompts following this protocol, then compare using test quota on NexAIX's compatible endpoint. You can complete the minimal action path within a week.



Comments(0)